Occasionally by happy coincidence current events align with the economic issue I had decided to write about that week. In my September 10 post I wrote about how capitalism is broken, and in subsequent posts (here and here) I addressed how to fix three of the six pillars of capitalism. This week I was going to address the last three pillars, but I realized there was just too much to unpack in a single post. Today I want to talk about the role of government in the economy. One of the pillars of capitalism is the notion that the role of government should be limited to protecting the rights of private citizens and maintaining an orderly environment that facilitates proper functioning of markets. The reason the topic is timely is because this week the government announced that the economy grew 4.9% in the third quarter of 2023, far higher than the expected 2.2%. The Biden administration is taking credit for the strong growth, begging the question: how much can – or should – government policies affect economic growth?
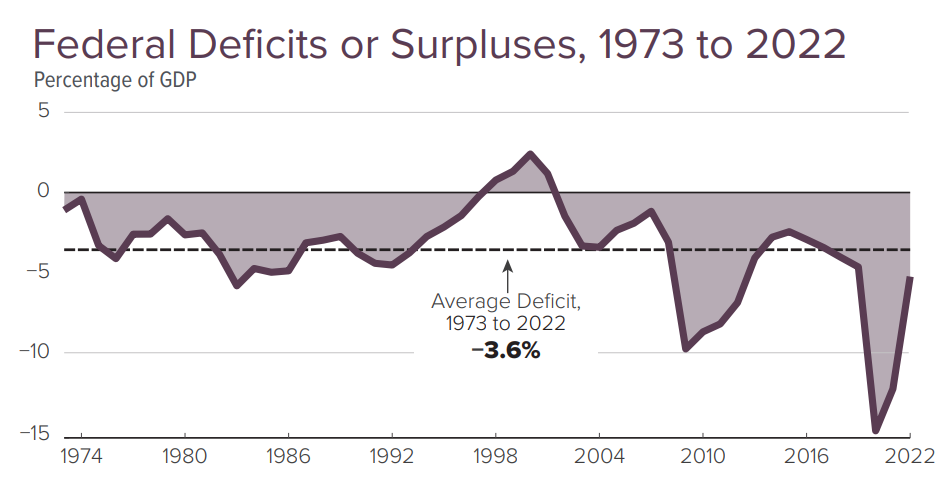
When people think of the size of the government, they usually mean the amount of spending by the federal government. In 2023,[i] the federal government collected $4.9 trillion (19.2% of GDP) from all sources, including individual and corporate income taxes, payroll taxes, corporate taxes and other fees. Federal government outlays totaled $6.3 trillion (24.6% of total GDP), leaving a deficit of nearly $1.4 trillion. That’s a big number, both in absolute terms and relative to GDP. Some of the deficit can be attributed to recovering from the Covid-19 pandemic, but a good chunk is also the result of reductions in income taxes enacted under President Trump and increases in spending under the Biden administration. The following graph[ii] shows how the federal deficit has evolved since 1973:
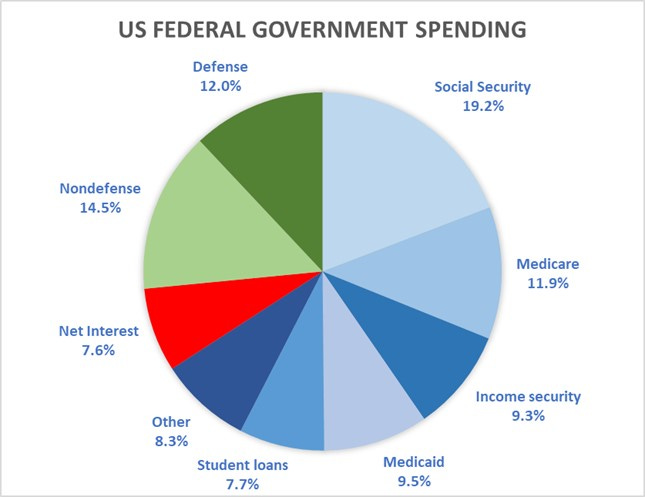
Nearly two-thirds of federal spending represents transfer payments, that is Social Security, Medicare, and other “entitlement” spending where the government takes money from one taxpayer and gives it to another. While some of the transfer payments are covered by payroll taxes, one-third of the federal budget deficit is the shortfall between payroll taxes and the amounts that are actually paid to recipients. But transfer payments do not contribute to GDP. Nothing new is produced or added to the economy. It is simply a matter of taking money from one person and giving it to another.
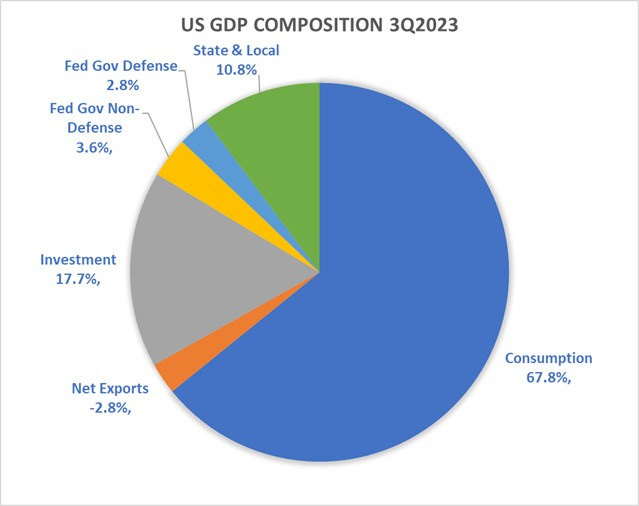
In addition to taking money from Peter and giving it to Paula, the government actually contributes to GDP. That is because the government produces things – it builds bridges and roads – and provides services – delivering the mail, processing driver licenses, fighting wars, etc. They create jobs and pay salaries just like any other company or individual that engages in the production of goods and services. The government’s share of GDP is really quite small, especially at the federal level. In fact, total federal government spending that is counted in GDP amounted to just about 6.5% of GDP in 2022. Of that, 2.9% is related to defense spending and just 3.6% of total US GDP is attributable to government non-defense spending. State and local governments are much larger, taking up nearly 11% of total GDP, which makes sense since states and municipalities run the schools, the police departments, the water treatments plants, and many more services that benefit their communities.
Between federal and state governments, 17.5% of GDP is generated by the public sector, which means 82.5% of GDP is generated by the private sector, including goods produced for private consumption and business investment in plants, equipment, and real estate. The composition of GDP has remained fairly stable over time. In the 1960s, consumer spending was a bit lower, and government spending substantially higher. But since the late 1980s at the end of Ronald Reagan’s second term, the distribution was almost identical to what it is today. The following chart shows the composition of U.S. GDP as of 4Q2023[iii]:
Not surprisingly, government spending on transfer payments swamps discretionary spending. The following chart shows where government spending goes:
So, what does all of this have with the recent announcement of strong GDP growth? While federal government spending is not a large percentage of overall GDP, it is the third essential leg of the economy, along with consumers and businesses. Government can help smooth out the inevitable booms and busts that occur in capitalism, and it can provide seed money to new industries and fund public / private partnerships to direct capital to underserved communities. Critics allege that the government should not be involved in choosing economic winners and losers, but those same critics seem to be fine with other aspects of corporate welfare, such as subsidies for energy, agriculture and transportation – often providing funds to highly profitable industries.
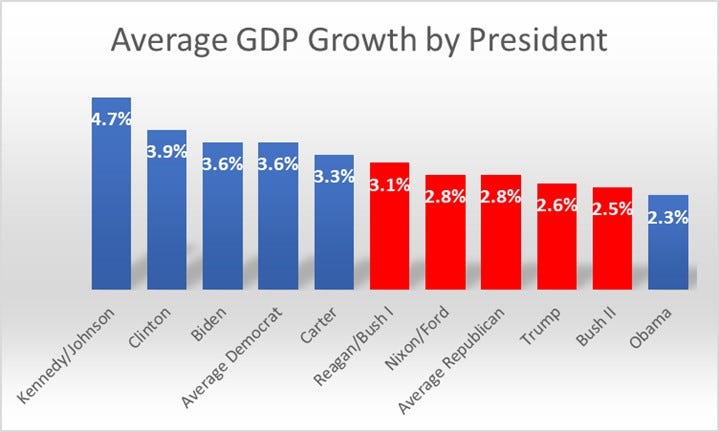
The Biden administration claims their economic policies are designed to grow the economy from the bottom up and the middle out, as opposed to the so-called “trickle-down” economics of prior Republican administrations. The two policies could not be more different, and the results are measurable. Obviously, GDP growth is not the only measure of economic wellbeing, but the evidence is clear that the economy does better under Democratic rather than Republican administrations. The following graph illustrates average annual real (net of inflation) GDP growth under every president since John Kennedy in 1960.
Economic growth was higher under every Democratic administration except President Obama’s. The reasons for sluggish growth under his administration are complex, but many economists believe he failed to respond aggressively enough to the financial crisis, although he was almost uniformly opposed by Republicans in Congress. And unemployment numbers are also better under Democrats, averaging 5.3% across administrations, versus 5.6% under Republicans.
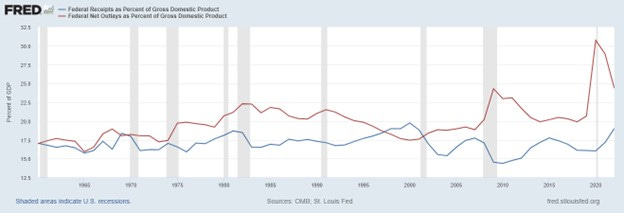
The current level of deficit spending is not sustainable, but how we close the gap matters. We can either raise taxes, reduce spending, or do both. As you can see in the following chart, since 1960, federal receipts as a percentage of GDP have hovered around 17% and are currently above that level. At the same time, federal outlays spiked during pandemic. Although they are coming back down, they remain above the long-term average of about 20% of GDP.
Clearly, there is room to bring spending down further, but as I will discuss in a future post, it doesn’t have to happen at the expense of hungry children and families. Some of it can come from the pockets of the billionaires (yes, I said it again) who have been funneling money from the government into their pockets for decades. Where do you think most of the government spending ends up? Defense spending goes to the shareholders of Lockheed Martin and General Dynamic; Medicare spending goes to the shareholders of United Healthcare and Pfizer; energy subsidies go to the shareholders of Exxon Mobile. If Biden’s policies succeed in growing the economy faster than the government spends money, the gap can be closed without the need for drastic reductions in social welfare programs. Social Security might need tweaking, and Medicare – especially Medicare Advantage – needs to be evaluated. But the big sucking sound in the federal deficit is not happening from the middle class down. It’s happening from the millionaire class up. To be continued….
[i] https://www.cbo.gov/system/files/2023-03/58888-Budget-Infographic.pdf
[ii] https://www.cbo.gov/system/files/2023-03/58888-Budget-Infographic.pdf
[iii] Source: Bureau of Economic Analysis


Again, very informative. Thank You